There it is - America's most dangerous jobs in 2007:
Also note that police officers' most common cause of death on the job are car accidents, not confrontation with criminals. Police officers' rate of death by homicide - about 8 per 100,000 - is just slightly above the rate for the general population (6.2 per 100,000), and is lower than the rate for general male population (10.0 per 100,000) or male population ages 20-59 (about 11 per 100,000).
Showing posts with label statistics. Show all posts
Showing posts with label statistics. Show all posts

Nov 5, 2008
TAKS and KKK effects
The TAKS effect: Every state that starts with "T", "A", "K" or "S" voted for McCain. There are 10 such states and they comprise 98 electoral votes. McCain won those states' popular vote by a margin of 14%.
Eliminate TAKS, and the rest of the country voted for Obama by a 10% margin (compared to the 6% for the whole country). The electoral vote count is 349-64 (with 27 yet to be determined).
The KKK effect: Every state with a "K" in its name voted for McCain. There are 8 such states and they have 41 electoral votes; McCain has won 40, while one from Nebraska is still uncertain. McCain won those states by 19%.
Eliminate KKK, and the rest of the country voted for Obama by an 8% margin, with the electoral vote count is 349-122 (with 26 yet to be determined).
Eliminate both TAKS and KKK, and Obama wins by 11% and 349-50 electoral votes (with 26 pending). Additionally, the 55-40 advantage in the Senate becomes 49-21, and the 245-157 advantage in the House becomes 219-121. (Pending seats not counted.)
Well, Mr. President, you may say there are no red states and blue states, but there sure are TAKS states and KKK states, and they don't like you very much. The rest of the country looks pretty normal.
UPDATE (many months later): Oops, not every state with a "K" voted for McCain. Thanks to Samer for correcting me.
Eliminate TAKS, and the rest of the country voted for Obama by a 10% margin (compared to the 6% for the whole country). The electoral vote count is 349-64 (with 27 yet to be determined).
The KKK effect: Every state with a "K" in its name voted for McCain. There are 8 such states and they have 41 electoral votes; McCain has won 40, while one from Nebraska is still uncertain. McCain won those states by 19%.
Eliminate KKK, and the rest of the country voted for Obama by an 8% margin, with the electoral vote count is 349-122 (with 26 yet to be determined).
Eliminate both TAKS and KKK, and Obama wins by 11% and 349-50 electoral votes (with 26 pending). Additionally, the 55-40 advantage in the Senate becomes 49-21, and the 245-157 advantage in the House becomes 219-121. (Pending seats not counted.)
Well, Mr. President, you may say there are no red states and blue states, but there sure are TAKS states and KKK states, and they don't like you very much. The rest of the country looks pretty normal.
UPDATE (many months later): Oops, not every state with a "K" voted for McCain. Thanks to Samer for correcting me.
Nov 3, 2008
Presidential election trivia II: states and electoral votes
Only 3 states have held the distinction of being the state with the most electoral votes: Virginia until 1808, New York 1812-1968, and California since 1972.
1812 was the first election in which some electoral votes came from west of the Mississippi - from Louisiana.
The second state west of the Mississippi was Missouri (first voted in the 1820 election), the third was Arkansas (1836), followed by Iowa and Texas in 1848 and California in 1852.
States that voted for the first Republican presidential candidate (John Frémont) in 1856: all of New England, plus Ohio, Michigan, Wisconsin, and Iowa. All except OH look reliably Democratic for 2008. All except OH and IA voted Democratic in 2004. All except OH and NH voted Democratic in 2000. All voted Democratic in 1992 and 1996.
Free states that voted for James Buchanan in 1856: Pennsylvania (his home state), Illinois, Indiana, New Jersey, and California (Frémont's home state). In 1860, Lincoln won all of them (NJ split its electoral votes 4-3 in Lincoln's favor).
States Lincoln lost in 1864: Kentucky (where he was born), Delaware, New Jersey. He won Missouri and Maryland although they were slave states. He won West Virginia which was still a slave state, although it was formally committed to abolishing slavery. He also won Kansas, where the status of slavery was violently contested before the Civil War.
1872 was the first time New Jersey went completely Republican and the last time until 1928 that Virginia voted Republican.
Southern states that never voted Republican during the Civil War or the Reconstruction: Georgia and Kentucky.
In 1876, Connecticut voted Democratic, the first New England state to do that since the emergence of the Republican Party.
In 1880, the South solidified Democratic. It was also the first time Nevada voted Democratic, and the first time California did so since 1856. The only time CA went D between 1880 and 1916 was in 1892, when it split its electoral votes 8D, 1R.
In 1900, the two Dakotas voted for the same candidate for the first time (in 1892, ND split its votes 3-way and SD voted R; in 1896, ND voted R and SD voted D; in 1900, they both went R.) They voted together in every subsequent election except 1912 (when ND voted Democratic and SD Progressive) and 1916 (ND-D, SD-R). Almost all those votes were for the Republican, except in 1932, 1936, and 1964.
In 1904, Missouri voted Republican for the first time since 1864. Teddy Roosevelt solidified the West - he won all states west of the Mississippi except Texas, Arkansas, and Louisiana. Roosevelt was the first candidate to win more than 300 electoral votes.
In 1912, Woodrow Wilson became the first candidate to win over 400 electoral votes (435 out of 531) and to carry 40 states (out of 48), despite winning only 41.8% of popular vote (which was the lowest percentage for the winner since Lincoln in 1860).
All New England states except Vermont went Democratic in 1912. Other than Connecticut, they had not done so since 1852. Massachusetts had not voted Democratic since 1820 (and in a contested election not since 1804). Ohio also went D for the first time since 1852.
Only Vermont and Utah voted Republican in1904 1912. (Six other states - PA, MI, MN, CA, WA, SD - voted Progressive.)
From 1856 to 1908, these were the only instances of states that border Canada voting Democratic:
In 1912, Woodrow Wilson became the first candidate to win over 400 electoral votes (435, out of 531) and to carry 40 states (out of 48) despite winning only 41.8% of the popular vote.
In 1916, the only Republican states west of the Mississippi were OR, SD, MN and IA; the West almost solidified D in a near-reversal of 1904. However, all of Northeast (except NH) was back in the Republican column.
Wilson won in 1916 despite losing his home state (NJ); he was the only presidential candidate ever to do that. Charles Hughes became the first candidate to lose despite winning more than 200 electoral votes (254). Only Al Gore won more EV while losing the election (267); had Florida been counted properly, the 2000 election would not have been as close as the 1916 one.
In 1920, Tennessee went Republican for the first time since 1868, and Oklahoma for the fist time since it became a state. The West was again solidly Republican as in 1904. Harding became the first Republican to win more than 400 EV.
In the three elections of the 1920s, the only Democratic electoral votes outside the Confederacy came from Kentucky in 1920, Oklahoma in 1924, and Massachusetts and Rhode Island in 1928.
1928 was the first election in which Texas and Kentucky voted Republican; Texas didn't go Republican again until 1952 and Kentucky not until 1956. Also, FL went R the first time since the controversial 1876 and NC and VA the first time since 1872. Hoover won more EV (444) than any Republican before him, and was the first Republican to carry 40 states.
In 1932, Minnesota voted Democratic for the first time ever, Michigan the first time since 1852, Ohio the second time since 1852 (the only exception was 1912), South Dakota the second time since statehood (first was in 1896), and Wisconsin the third time since 1852 (the first two were 1892 and 1912).
In 1936, FDR won 523 electoral votes out of 531. Ronald Reagan won 525 EV in 1984, but out of a greater total (538), so that FDR still holds the record for the highest percentage of electoral votes won.
States that voted against FDR:
Harry Truman in 1948 was the first Democratic nominee to lose SC and LA since 1876 and MS and AL since 1872. (Of course, Thurmond, who won them, was also a Democrat at the time, so it wasn't a party realignment.)
In 1952, Texas went Republican for the second time ever, Virginia for the second time since 1872, and Florida the second time since 1876. (In each case, the first time was in 1928.) In a dramatic switch of allegiance, Virginia has only voted Democratic once since - in 1964.
In 1956, Eisenhower carried more states (41) and won more electoral votes (457) than any Republican before him. Eisenhower's cumulative total of 899 EVs was second only to FDR's. (It has since been exceeded by Nixon and Reagan.) Louisiana went Republican the first time since 1876.
Eisenhower won Massachusetts twice, the only Republican to do sosince McKinley between McKinley and Reagan.
In 1960, Nixon won more states than JFK (26-22), but lost the Electoral College 303-219. It was the first election in which the loser carried more states than the winner since the anomalous 1824 election, which was decided by the House of Representatives. (Garfield and Hancock carried 19 states each in 1880; Taylor and Cass carried 15 each in 1848.) It happened again in 1976, when Ford won more states than Carter, and it would have happened in 2000 if Gore had won Florida.
Pennsylvania and Michigan voted for JFK in 1960. The only Democrat they had voted for since 1856 (1852 in Michigan's case) was FDR (and each state even voted against him once).
1964 landslide LBJ victory was the only time Alaska voted Democratic, the first time Vermont voted D since 1852, and the second time ME voted D since 1852 (first was in 1912). However, it was also the first time ever that Georgia voted Republican (it didn't do so even during the Reconstruction) and the best Republican showing in the Deep South (all 5 states, 47 EVs) ever, and the only time R had done better in the Confederacy since 1872 was in 1928, when Hoover won 5 states and 62 EVs. Interestingly, there is no Southern state that both Hoover and Goldwater carried. (They did both carry Arizona, however.) 1964 was the last time Virginia voted Democratic.
1968 was the last time a third-party candidate won electoral votes. George Wallace carried 5 states (AR, LA, MS, AL, GA) worth 46 electoral votes. 4 of the 5 states were Goldwater states in 1964; the difference is that Wallace carried AR, but lost SC.
Before Wallace, the last third-party candidate to win electoral votes was Harry Byrd, who won 15 EVs in 1960, carrying Mississippi, the majority of Alabama's EV, and 1 EV from Oklahoma. His running mate, Strom Thurmond, had won 4 states (LA, MS, AL, SC) and 39 EVs in 1948.
The last non-Dixiecrat who won EVs as a third-party candidate was Robert M. La Follette, Sr., Progressive who won Wisconsin's 13 EV in 1924. Teddy Roosevelt, running as a Progressive in 1912, made the best showing of any third-party candidate, winning 6 states and 88 EV. He won more popular and more electoral votes than the Republican candidate William Howard Taft. In 1888, Populist Weaver won 4 states (KS, CO, NV, ID) and partial EV from another two (OR, ND), for a total of 22 EV.
In 1872, 6 candidates won EVs, but all of them were Republicans and Democrats (and the election was complicated by Greeley's death). In 1860, 4 candidates won EVs: Lincoln (Republican) 180, Breckinridge (Southern Democrat) 72, Douglas (Northern Democrat) 12, and Bell (Constitutional Union) 39. Bell won KY, TN, and VA. Douglas only won MO, despite winning almost as many popular votes as Breckinridge and Bell together.
Millard Fillmore carried Maryland's 8 EV as the Know-Nothing candidate in 1856.
5 people won EVs in 1836, but they were all Democrats or Whigs. In 1832, Nullifier John Floyd won South Carolina and Anti-Masonic William Wirt won Vermont. And, of course, in 1824, four Democratic-Republicans split the EV and the House had to decide the election.
In 1972, Nixon set the record, carrying 49 states. He failed to top FDR's 523 EV, but his 520 brought his cumulative total to 1040, surpassing Eisenhower and remaining to this day second only to FDR. It was also the first time the Republican candidate swept the Confederacy, and the first time Hawaii voted Republican
1976 was the closest EV race between 1916 and 2000. Ford won more states than Carter (27 vs. 23+DC), but Carter won 297 EV to Ford's 240 (plus 1 that a rogue elector cast for Reagan). It was also the last time a Democrat won MS, AL, SC, or NC.
In 1980 and 1984 Reagan won Massachusetts. The only other Republican to win MA since 1924 was Eisenhower(who won it twice).
Reagan's 525 EV in 1984 was the most ever (but FDR won a higher percentage of EV in 1936) and his 49 states tied Nixon's record from 1972. It was the second and last time Hawaii went Republican. Reagan's 1014 cumulative EV total (1015 if 1976 is counted) is the third-highest ever (after FDR and Nixon), but the highest ever from two elections. (FDR's 2-election best is 995 in 1932-36.) The last candidate to lose fewer electoral votes in two elections was James Monroe, who was barely opposed in 1816 and essentially unopposed in 1820. Monroe lost a total of 37 EV, but he only won 411, so percentage-wise Reagan did better. Only Washington did clearly better than Reagan in this respect, but he was unopposed both times.
1988 was the last time CA, CT, DE, IL, MD, ME, MI, NJ, PA and VT voted Republican.
1992 was the last time CO, GA and MT voted Democratic.
1996 was the last time "the man" (column of 5 states comprising MN, IA, MO, AR and LA) voted for the same candidate. (It also happened in 1932, 1936, 1972, and 1992, so FDR, Nixon and Clinton were the only candidates to carry all those 5 states.) It was also the last time AR, AZ, FL, KY, LA, MO, NV, OH, TN, and WV voted Democratic; in Arizona's case, it was the only time since 1948.
In 2000, Al Gore got the most EV ever for a losing candidate (267, but officially 266 because one elector cast a protest vote). It was also the last election in which the 2 largest states went for the same candidate (and the last election in which NY was the 2nd-largest state).
1812 was the first election in which some electoral votes came from west of the Mississippi - from Louisiana.
The second state west of the Mississippi was Missouri (first voted in the 1820 election), the third was Arkansas (1836), followed by Iowa and Texas in 1848 and California in 1852.
States that voted for the first Republican presidential candidate (John Frémont) in 1856: all of New England, plus Ohio, Michigan, Wisconsin, and Iowa. All except OH look reliably Democratic for 2008. All except OH and IA voted Democratic in 2004. All except OH and NH voted Democratic in 2000. All voted Democratic in 1992 and 1996.
Free states that voted for James Buchanan in 1856: Pennsylvania (his home state), Illinois, Indiana, New Jersey, and California (Frémont's home state). In 1860, Lincoln won all of them (NJ split its electoral votes 4-3 in Lincoln's favor).
States Lincoln lost in 1864: Kentucky (where he was born), Delaware, New Jersey. He won Missouri and Maryland although they were slave states. He won West Virginia which was still a slave state, although it was formally committed to abolishing slavery. He also won Kansas, where the status of slavery was violently contested before the Civil War.
1872 was the first time New Jersey went completely Republican and the last time until 1928 that Virginia voted Republican.
Southern states that never voted Republican during the Civil War or the Reconstruction: Georgia and Kentucky.
In 1876, Connecticut voted Democratic, the first New England state to do that since the emergence of the Republican Party.
In 1880, the South solidified Democratic. It was also the first time Nevada voted Democratic, and the first time California did so since 1856. The only time CA went D between 1880 and 1916 was in 1892, when it split its electoral votes 8D, 1R.
In 1900, the two Dakotas voted for the same candidate for the first time (in 1892, ND split its votes 3-way and SD voted R; in 1896, ND voted R and SD voted D; in 1900, they both went R.) They voted together in every subsequent election except 1912 (when ND voted Democratic and SD Progressive) and 1916 (ND-D, SD-R). Almost all those votes were for the Republican, except in 1932, 1936, and 1964.
In 1904, Missouri voted Republican for the first time since 1864. Teddy Roosevelt solidified the West - he won all states west of the Mississippi except Texas, Arkansas, and Louisiana. Roosevelt was the first candidate to win more than 300 electoral votes.
In 1912, Woodrow Wilson became the first candidate to win over 400 electoral votes (435 out of 531) and to carry 40 states (out of 48), despite winning only 41.8% of popular vote (which was the lowest percentage for the winner since Lincoln in 1860).
All New England states except Vermont went Democratic in 1912. Other than Connecticut, they had not done so since 1852. Massachusetts had not voted Democratic since 1820 (and in a contested election not since 1804). Ohio also went D for the first time since 1852.
Only Vermont and Utah voted Republican in
From 1856 to 1908, these were the only instances of states that border Canada voting Democratic:
- New York in 1868, 1876, 1884, and 1892; each time, the Democratic candidate was from NY.
- Washington, Idaho and Montana in 1896 (and ID and MT again in 1900).
- Also, in 1892, Michigan split its votes R9, D5, North Dakota split 3-way (D-R-P), and Idaho went Populist.
- California in 1856 and 1880; also splitting its votes in 1892 (D8, R1) and 1896 (D1, R8);
- Oregon in 1868;
- Washington in 1896.
In 1912, Woodrow Wilson became the first candidate to win over 400 electoral votes (435, out of 531) and to carry 40 states (out of 48) despite winning only 41.8% of the popular vote.
In 1916, the only Republican states west of the Mississippi were OR, SD, MN and IA; the West almost solidified D in a near-reversal of 1904. However, all of Northeast (except NH) was back in the Republican column.
Wilson won in 1916 despite losing his home state (NJ); he was the only presidential candidate ever to do that. Charles Hughes became the first candidate to lose despite winning more than 200 electoral votes (254). Only Al Gore won more EV while losing the election (267); had Florida been counted properly, the 2000 election would not have been as close as the 1916 one.
In 1920, Tennessee went Republican for the first time since 1868, and Oklahoma for the fist time since it became a state. The West was again solidly Republican as in 1904. Harding became the first Republican to win more than 400 EV.
In the three elections of the 1920s, the only Democratic electoral votes outside the Confederacy came from Kentucky in 1920, Oklahoma in 1924, and Massachusetts and Rhode Island in 1928.
1928 was the first election in which Texas and Kentucky voted Republican; Texas didn't go Republican again until 1952 and Kentucky not until 1956. Also, FL went R the first time since the controversial 1876 and NC and VA the first time since 1872. Hoover won more EV (444) than any Republican before him, and was the first Republican to carry 40 states.
In 1932, Minnesota voted Democratic for the first time ever, Michigan the first time since 1852, Ohio the second time since 1852 (the only exception was 1912), South Dakota the second time since statehood (first was in 1896), and Wisconsin the third time since 1852 (the first two were 1892 and 1912).
In 1936, FDR won 523 electoral votes out of 531. Ronald Reagan won 525 EV in 1984, but out of a greater total (538), so that FDR still holds the record for the highest percentage of electoral votes won.
States that voted against FDR:
- ME, VT - all 4 times;
- IN, ND, SD, NE, KS, IA, CO - twice (1940, 1944);
- PA, DE, CT, NH in 1932;
- MI in 1940;
- WY, OH in 1944.
Harry Truman in 1948 was the first Democratic nominee to lose SC and LA since 1876 and MS and AL since 1872. (Of course, Thurmond, who won them, was also a Democrat at the time, so it wasn't a party realignment.)
In 1952, Texas went Republican for the second time ever, Virginia for the second time since 1872, and Florida the second time since 1876. (In each case, the first time was in 1928.) In a dramatic switch of allegiance, Virginia has only voted Democratic once since - in 1964.
In 1956, Eisenhower carried more states (41) and won more electoral votes (457) than any Republican before him. Eisenhower's cumulative total of 899 EVs was second only to FDR's. (It has since been exceeded by Nixon and Reagan.) Louisiana went Republican the first time since 1876.
Eisenhower won Massachusetts twice, the only Republican to do so
In 1960, Nixon won more states than JFK (26-22), but lost the Electoral College 303-219. It was the first election in which the loser carried more states than the winner since the anomalous 1824 election, which was decided by the House of Representatives. (Garfield and Hancock carried 19 states each in 1880; Taylor and Cass carried 15 each in 1848.) It happened again in 1976, when Ford won more states than Carter, and it would have happened in 2000 if Gore had won Florida.
Pennsylvania and Michigan voted for JFK in 1960. The only Democrat they had voted for since 1856 (1852 in Michigan's case) was FDR (and each state even voted against him once).
1964 landslide LBJ victory was the only time Alaska voted Democratic, the first time Vermont voted D since 1852, and the second time ME voted D since 1852 (first was in 1912). However, it was also the first time ever that Georgia voted Republican (it didn't do so even during the Reconstruction) and the best Republican showing in the Deep South (all 5 states, 47 EVs) ever, and the only time R had done better in the Confederacy since 1872 was in 1928, when Hoover won 5 states and 62 EVs. Interestingly, there is no Southern state that both Hoover and Goldwater carried. (They did both carry Arizona, however.) 1964 was the last time Virginia voted Democratic.
1968 was the last time a third-party candidate won electoral votes. George Wallace carried 5 states (AR, LA, MS, AL, GA) worth 46 electoral votes. 4 of the 5 states were Goldwater states in 1964; the difference is that Wallace carried AR, but lost SC.
Before Wallace, the last third-party candidate to win electoral votes was Harry Byrd, who won 15 EVs in 1960, carrying Mississippi, the majority of Alabama's EV, and 1 EV from Oklahoma. His running mate, Strom Thurmond, had won 4 states (LA, MS, AL, SC) and 39 EVs in 1948.
The last non-Dixiecrat who won EVs as a third-party candidate was Robert M. La Follette, Sr., Progressive who won Wisconsin's 13 EV in 1924. Teddy Roosevelt, running as a Progressive in 1912, made the best showing of any third-party candidate, winning 6 states and 88 EV. He won more popular and more electoral votes than the Republican candidate William Howard Taft. In 1888, Populist Weaver won 4 states (KS, CO, NV, ID) and partial EV from another two (OR, ND), for a total of 22 EV.
In 1872, 6 candidates won EVs, but all of them were Republicans and Democrats (and the election was complicated by Greeley's death). In 1860, 4 candidates won EVs: Lincoln (Republican) 180, Breckinridge (Southern Democrat) 72, Douglas (Northern Democrat) 12, and Bell (Constitutional Union) 39. Bell won KY, TN, and VA. Douglas only won MO, despite winning almost as many popular votes as Breckinridge and Bell together.
Millard Fillmore carried Maryland's 8 EV as the Know-Nothing candidate in 1856.
5 people won EVs in 1836, but they were all Democrats or Whigs. In 1832, Nullifier John Floyd won South Carolina and Anti-Masonic William Wirt won Vermont. And, of course, in 1824, four Democratic-Republicans split the EV and the House had to decide the election.
In 1972, Nixon set the record, carrying 49 states. He failed to top FDR's 523 EV, but his 520 brought his cumulative total to 1040, surpassing Eisenhower and remaining to this day second only to FDR. It was also the first time the Republican candidate swept the Confederacy, and the first time Hawaii voted Republican
1976 was the closest EV race between 1916 and 2000. Ford won more states than Carter (27 vs. 23+DC), but Carter won 297 EV to Ford's 240 (plus 1 that a rogue elector cast for Reagan). It was also the last time a Democrat won MS, AL, SC, or NC.
In 1980 and 1984 Reagan won Massachusetts. The only other Republican to win MA since 1924 was Eisenhower
Reagan's 525 EV in 1984 was the most ever (but FDR won a higher percentage of EV in 1936) and his 49 states tied Nixon's record from 1972. It was the second and last time Hawaii went Republican. Reagan's 1014 cumulative EV total (1015 if 1976 is counted) is the third-highest ever (after FDR and Nixon), but the highest ever from two elections. (FDR's 2-election best is 995 in 1932-36.) The last candidate to lose fewer electoral votes in two elections was James Monroe, who was barely opposed in 1816 and essentially unopposed in 1820. Monroe lost a total of 37 EV, but he only won 411, so percentage-wise Reagan did better. Only Washington did clearly better than Reagan in this respect, but he was unopposed both times.
1988 was the last time CA, CT, DE, IL, MD, ME, MI, NJ, PA and VT voted Republican.
1992 was the last time CO, GA and MT voted Democratic.
1996 was the last time "the man" (column of 5 states comprising MN, IA, MO, AR and LA) voted for the same candidate. (It also happened in 1932, 1936, 1972, and 1992, so FDR, Nixon and Clinton were the only candidates to carry all those 5 states.) It was also the last time AR, AZ, FL, KY, LA, MO, NV, OH, TN, and WV voted Democratic; in Arizona's case, it was the only time since 1948.
In 2000, Al Gore got the most EV ever for a losing candidate (267, but officially 266 because one elector cast a protest vote). It was also the last election in which the 2 largest states went for the same candidate (and the last election in which NY was the 2nd-largest state).
Presidential election trivia I: national popular vote
First to get more than 1 million votes: William Henry Harrison and Martin Van Buren in 1840.
First to get more than 2 million votes: Abraham Lincoln in 1864. He won 55% of the total vote in this wartime election. (In his first election, before the South seceded, he won less than 40%, although it was still more than 10% more than the nearest opponent.)
First to get more than 3 million votes: Ulysses S. Grant in 1868. Grant won 55.6% of the popular vote, more than any candidate since Andrew Jackson in 1828.
First to get more than 4 million votes: Rutherford B. Hayes and Samuel J. Tlden in 1876. Famously (or infamously), Tilden got more votes, the election hinged on Florida and was decided by a commission along partisan lines.
First to get more than 5 million votes: Benjamin Harrison and Grover Cleveland in 1888. Cleveland got more votes, but Harrison prevailed in the Electoral College. That didn't happen again until 2000.
First to get more than 7 million votes: William McKinley in 1896. McKinley was the first candidate to get more than 50% of the vote since Tilden in 1976 and first to win with more than 50% since Grant in 1872. William Jennings Bryan won over 6 million votes, more than any candidate before that year.
First to win by a margin of more than 1 million votes: Teddy Roosevelt in 1904. His margin was actually over 2 million votes, and his percentage (56.4%) was more than anyone's since Monroe ran unopposed in 1820. (Interestingly, his Electoral College victory was not particularly lopsided: he won 32 out of 45 states and 70% of the electoral vote. He was, however, the first candidate to win over 300 electoral votes.)
First to get more than 10 million votes: Warren G. Harding in 1920. Harding was also the first to get more than 15 million (actually more than 16 million), the first to win by a margin exceeding 5 million (actually over 7 million) and the first to win more than 60% of the popular vote in 100 years, since Monroe in 1820 (and first to do that in a competitive race since 1808). It is interesting how little relation there was between his electoral success and his record as President. He must not have been unpopular in his time, though: when his successor Calvin Coolidge ran for reelection, he won by a popular-vote margin of 25.2%.
First to get more than 20 million votes: Herbert Hoover in 1928. Hoover also set the new record with 444 electoral votes. His opponent, Alfred E. Smith, became the first losing candidate with more than 10 million votes.
Franklin D. Roosevelt set the new popular-vote record in 1932, although without crossing any trivia-worthy milestone. However, his popular-vote percentage (57.4%) was the highest for a Democrat since Andrew Jackson. Moreover, he was the first Democrat to get more than 50% of the vote since Tilden in 1876 (neither Cleveland nor Wilson ever accomplished that) and the first Democrat to win with more than 50% of popular votes since Pierce in 1852.
First to get more than 25 million votes, and first to win by a margin of more than 10 million votes: FDR in 1936. (Only LBJ in 1964, Nixon in 1972 and Reagan in 1984 have won by more than 10 million votes since.) His 27.7 million votes was not surpassed until 1952. FDR also bested Harding's modern-era record in popular-vote percentage (60.8% vs. 60.3%). His 523 electoral votes remained the record until 1984 and is still the record percentage-wise (2 states have been added to the Union and DC has become represented in the Electoral College since then).
FDR was also the first candidate to win a cumulative total of over 100 million votes. In his 4 presidential elections, he won a total of 103 million votes.
First to lose despite getting more than 20 million votes: Wendell Wilkie in 1940.
First to get more than 30 million votes: Dwight Eisenhower in 1952. In his 1956 reelection, Eisenhower got over 35 million votes, and won more states (41) and electoral votes (457) than any Republican before him.
First to lose despite getting more than 30 million votes: Richard Nixon in 1960. Nixon was also the first loser to get more votes than FDR got in any single election.
Popular-vote records set by Lyndon B. Johnson in 1964: first to get over 40 million (43.1 million), highest modern-time percentage (61.1%), first to win by a margin of more than 15 million. It was also the first time Vermont voted for a Democrat since 1852 and the only time ever Alaska did so, but also the first time ever that Georgia voted for a Republican (which it didn't do even during Reconstruction).
First to get more than 45 million votes: Richard Nixon in 1972. In his 3 presidential elections, Nixon won a cumulative total of 113 million votes, breaking FDR's record. Nixon's cumulative vote record still stands.
First to get more than 50 million votes: Ronald Reagan in 1984.
Reagan is the most recent president who won more than 50% of the vote twice. That is a surprisingly rare feat; the only presidents who accomplished that before Reagan were Eisenhower, FDR, McKinley, Grant, Jackson, Monroe, Madison, Jefferson, and Washington. Note that the list includes 3 Founding Fathers, one who essentially ran unopposed (Monroe), three generals famous for critical victories in major wars (Jackson, Grant, Eisenhower) and only 3 "normal" politicians (McKinley, FDR, Reagan). Of the 5 candidates on the list whose popular vote counts are reasonably meaningful (that would be starting with Grant), FDR had the highest average vote percentage (56.6%), followed by Eisenhower (56.3%), Reagan (54.8%), Grant (54.2%), and McKinley (51.3%).
First to lose despite getting more than 40 million votes: Michael Dukakis in 1988.
Bill Clinton was the first president since Wilson to win twice with less than 50% of the popular vote. That is an even rarer feat than winning twice with over 50%; only 3 candidates ever did it. (The third, or chronologically the first, was Grover Cleveland.)
First to lose despite getting more than 50 million votes: Al Gore in 2000. Of course, Al Gore lost only because the votes in Florida were not properly counted.
First to get more than 60 million votes: George W. Bush in 2004. Bush thus joined FDR and Nixon as only the third person to get more than 100 million cumulative votes. He failed to best Nixon's record, but he did win the most votes in 2 elections. (Nixon's cumulative votes are a 3-election total, and FDR's are over 4 elections.)
Will Obama exceed 70 million? With a good turnout, that is possible.
Honorable mention list: John Kerry (2004), James M. Cox (1920), Charles Hughes (1916), William Jennings Bryan (1896), Grover Cleveland (1888), James Blaine (1884), Winfield Scott Hancock (1880), Samuel J. Tilden (1876), Horatio Seymour (1868), Winfield Scott (1852), Henry Clay (1844), Martin Van Buren (1840), John Q. Adams (1828), Andrew Jackson (1824), DeWitt Clinton (1812), and Thomas Jefferson (1796) lost, but got more votes that anyone before them. Cleveland, Tilden and Jackson also got more votes than the winner of their election. (Note that John Adams in 1800, Charles Pinckney in 1804, Horace Greeley in 1872, Benjamin Harrison in 1892, William Jennings Bryan in 1900, Herbert Hoover in 1932, Wendell Wilkie in 1940, and Thomas Dewey in 1948 also got more votes than anyone other than themselves or the winner of their election.)
First to get more than 2 million votes: Abraham Lincoln in 1864. He won 55% of the total vote in this wartime election. (In his first election, before the South seceded, he won less than 40%, although it was still more than 10% more than the nearest opponent.)
First to get more than 3 million votes: Ulysses S. Grant in 1868. Grant won 55.6% of the popular vote, more than any candidate since Andrew Jackson in 1828.
First to get more than 4 million votes: Rutherford B. Hayes and Samuel J. Tlden in 1876. Famously (or infamously), Tilden got more votes, the election hinged on Florida and was decided by a commission along partisan lines.
First to get more than 5 million votes: Benjamin Harrison and Grover Cleveland in 1888. Cleveland got more votes, but Harrison prevailed in the Electoral College. That didn't happen again until 2000.
First to get more than 7 million votes: William McKinley in 1896. McKinley was the first candidate to get more than 50% of the vote since Tilden in 1976 and first to win with more than 50% since Grant in 1872. William Jennings Bryan won over 6 million votes, more than any candidate before that year.
First to win by a margin of more than 1 million votes: Teddy Roosevelt in 1904. His margin was actually over 2 million votes, and his percentage (56.4%) was more than anyone's since Monroe ran unopposed in 1820. (Interestingly, his Electoral College victory was not particularly lopsided: he won 32 out of 45 states and 70% of the electoral vote. He was, however, the first candidate to win over 300 electoral votes.)
First to get more than 10 million votes: Warren G. Harding in 1920. Harding was also the first to get more than 15 million (actually more than 16 million), the first to win by a margin exceeding 5 million (actually over 7 million) and the first to win more than 60% of the popular vote in 100 years, since Monroe in 1820 (and first to do that in a competitive race since 1808). It is interesting how little relation there was between his electoral success and his record as President. He must not have been unpopular in his time, though: when his successor Calvin Coolidge ran for reelection, he won by a popular-vote margin of 25.2%.
First to get more than 20 million votes: Herbert Hoover in 1928. Hoover also set the new record with 444 electoral votes. His opponent, Alfred E. Smith, became the first losing candidate with more than 10 million votes.
Franklin D. Roosevelt set the new popular-vote record in 1932, although without crossing any trivia-worthy milestone. However, his popular-vote percentage (57.4%) was the highest for a Democrat since Andrew Jackson. Moreover, he was the first Democrat to get more than 50% of the vote since Tilden in 1876 (neither Cleveland nor Wilson ever accomplished that) and the first Democrat to win with more than 50% of popular votes since Pierce in 1852.
First to get more than 25 million votes, and first to win by a margin of more than 10 million votes: FDR in 1936. (Only LBJ in 1964, Nixon in 1972 and Reagan in 1984 have won by more than 10 million votes since.) His 27.7 million votes was not surpassed until 1952. FDR also bested Harding's modern-era record in popular-vote percentage (60.8% vs. 60.3%). His 523 electoral votes remained the record until 1984 and is still the record percentage-wise (2 states have been added to the Union and DC has become represented in the Electoral College since then).
FDR was also the first candidate to win a cumulative total of over 100 million votes. In his 4 presidential elections, he won a total of 103 million votes.
First to lose despite getting more than 20 million votes: Wendell Wilkie in 1940.
First to get more than 30 million votes: Dwight Eisenhower in 1952. In his 1956 reelection, Eisenhower got over 35 million votes, and won more states (41) and electoral votes (457) than any Republican before him.
First to lose despite getting more than 30 million votes: Richard Nixon in 1960. Nixon was also the first loser to get more votes than FDR got in any single election.
Popular-vote records set by Lyndon B. Johnson in 1964: first to get over 40 million (43.1 million), highest modern-time percentage (61.1%), first to win by a margin of more than 15 million. It was also the first time Vermont voted for a Democrat since 1852 and the only time ever Alaska did so, but also the first time ever that Georgia voted for a Republican (which it didn't do even during Reconstruction).
First to get more than 45 million votes: Richard Nixon in 1972. In his 3 presidential elections, Nixon won a cumulative total of 113 million votes, breaking FDR's record. Nixon's cumulative vote record still stands.
First to get more than 50 million votes: Ronald Reagan in 1984.
Reagan is the most recent president who won more than 50% of the vote twice. That is a surprisingly rare feat; the only presidents who accomplished that before Reagan were Eisenhower, FDR, McKinley, Grant, Jackson, Monroe, Madison, Jefferson, and Washington. Note that the list includes 3 Founding Fathers, one who essentially ran unopposed (Monroe), three generals famous for critical victories in major wars (Jackson, Grant, Eisenhower) and only 3 "normal" politicians (McKinley, FDR, Reagan). Of the 5 candidates on the list whose popular vote counts are reasonably meaningful (that would be starting with Grant), FDR had the highest average vote percentage (56.6%), followed by Eisenhower (56.3%), Reagan (54.8%), Grant (54.2%), and McKinley (51.3%).
First to lose despite getting more than 40 million votes: Michael Dukakis in 1988.
Bill Clinton was the first president since Wilson to win twice with less than 50% of the popular vote. That is an even rarer feat than winning twice with over 50%; only 3 candidates ever did it. (The third, or chronologically the first, was Grover Cleveland.)
First to lose despite getting more than 50 million votes: Al Gore in 2000. Of course, Al Gore lost only because the votes in Florida were not properly counted.
First to get more than 60 million votes: George W. Bush in 2004. Bush thus joined FDR and Nixon as only the third person to get more than 100 million cumulative votes. He failed to best Nixon's record, but he did win the most votes in 2 elections. (Nixon's cumulative votes are a 3-election total, and FDR's are over 4 elections.)
Will Obama exceed 70 million? With a good turnout, that is possible.
Honorable mention list: John Kerry (2004), James M. Cox (1920), Charles Hughes (1916), William Jennings Bryan (1896), Grover Cleveland (1888), James Blaine (1884), Winfield Scott Hancock (1880), Samuel J. Tilden (1876), Horatio Seymour (1868), Winfield Scott (1852), Henry Clay (1844), Martin Van Buren (1840), John Q. Adams (1828), Andrew Jackson (1824), DeWitt Clinton (1812), and Thomas Jefferson (1796) lost, but got more votes that anyone before them. Cleveland, Tilden and Jackson also got more votes than the winner of their election. (Note that John Adams in 1800, Charles Pinckney in 1804, Horace Greeley in 1872, Benjamin Harrison in 1892, William Jennings Bryan in 1900, Herbert Hoover in 1932, Wendell Wilkie in 1940, and Thomas Dewey in 1948 also got more votes than anyone other than themselves or the winner of their election.)
Sep 30, 2008
Voters deserve better actuaries
Bragg is promoting his actuarial analysis of McCain and Obama again:
Let's start from the average mortality, given only the candidates' age and sex. McCain is 72 years and 32 days old and he will be 80 years and 144 days old on January 20, 2017. Using Social Security's life tables, his probability of dying before the end of his second term is 32.2%. Barack Obama is 47 years and 57 days old; his probability of dying by the same day, which in his case is age 55 years and 169 days, is 4.3%.
(Non-geeks may skip this paragraph: I used the 1940 cohort table for McCain and 1960 cohort table for Obama. Those are the closest to their birth years. Those choices favor McCain by the amount of mortality improvement from his 1936 cohort to the 1940 cohort. The difference is hardly negligible: using the 1930 cohort, we'd get 34.7% for the same ages, and linear interpolation yields approximately 33.2%, so the result I used is biased in McCain's favor by about 1 percentage point. Similarly, using 1960 cohort mortality for Obama introduces a slight - although almost negligible in this case - bias against Obama. One further geek note: I derived all survival probabilities by linear interpolation between nearest integer-year ages. That is more than accurate enough for the purpose of this analysis.)
Of course, there is more information available about the candidates, and Bragg lists some factors used:
That is hardly an unbiased account, and the statement that "McCain allowed reporters to review eight years of medical records" is, at best, barely true. In any case, the factors mentioned in the article should be worse news for McCain than for Obama.
Let's start with smoking. It is true that Obama wouldn't qualify for non-smoker rates if he applied for a life insurance policy today, but life insurance underwriting imposes rather crude discrete categories by necessity. (Verification is costly and the potential for cheating is high; for example, someone who smokes two packs a day could claim to smoke one pack a week.) This individualized analysis can do much better than that. Obama's quitting has not been entirely successful, but he is clearly closer to a former smoker than to a current one. McCain stopped smoking years ago, but he used to smoke two packs a day for 25 years. So they have a similar smoking history and quit at a similar age. By itself, this factor would make each of them more likely to die than an average man of their age. The effect is probably greater for Obama mainly because fewer men of his age are smokers, so average mortality for his cohort is based on a higher percentage of non-smokers. I would be curious to see what factors Bragg applied to account for smoking history.
(Another note for wonks: Insurers generally charge smokers double or even higher rates than nonsmokers, and that is soundly based on experience, but those factors apply to a baseline of the insured population, i.e., to the people who have passed other underwriting hurdles. For example, by the Society of Actuaries' 90-95 Basic Select tables, a male smoker of Obama's age would have about 3.5% chance of dying in the next 8 years, which is better than the average from the Social Security tables. Similarly, a smoker of McCain's age would have 23% chance of dying in the next 8 years, again better than in the SSA tables. Another thing to keep in mind is that, in insurance underwriting, smoking also serves as a proxy to other risky behavior, which means that not all of the excess mortality of smokers is caused by smoking.)
The candidates' fitness balances their smoking history. Both candidates seem to have healthy hearts, and Obama's pulse and blood pressure cited by Bragg are impressive. Obama is thin and McCain's weight is normal. They both seem significantly more fit than average men of their respective ages. Fitness-related mortality patterns are far less well known than smoking-related ones, but my guess would be that both candidates make up in fitness about as much as they lose from smoking history. Additionally, both are married and have (as far as we know) healthy spouses, which also improves their longevity prospects. Not to mention that both have access to best available health care.
So far, very similar adjustments to age/sex baseline apply to both candidates, but the rest is all bad news for McCain. Melanoma is a serious type of cancer, prone to metastasizing that is hard to detect and treat. It is true that McCain has been free of symptoms for 8 years and that it improves his prognosis, but the fact that he's had 4 episodes of melanoma, and that the last one was over 2 mm deep, raise additional concerns. For lesions like his last one, 5-year survival rate is 63-79% and 10-year 51-64%. He has survived for 8 years, so the greatest risk is behind him, but he is not out of the woods:
Another issue for McCain is the long-term effects of maltreatment by the Vietcong. Five and a half years of injuries, torture and malnutrition certainly have health consequences. Quantifying the effect is difficult, but that's not a good reason to ignore it altogether.
In summary, there is little reason to think that Obama's probability of dying in the next 8 years exceeds that of an average man of his age - 4.3 percent. In fact, it is probably less than 3.5 percent, the number based on life insurance policy experience. On the other hand, I don't see how McCain's probability of dying in the same period would be much less than one-third. In other words, McCain is at least 9 times as likely to die in office as Obama. Bragg tells us it is not quite 4.5 times. Unless he publishes more details about the calculation and the assumptions, I can't see how his results could be justified.
UPDATE: It is probably wrong to focus on survival to the end of second term. Incumbency is an advantage in an election, but we don't elect a President for 8 years, and we would (hopefully) have updated health information before the next election. Going back to the baseline (Social Security tables), a man of McCain's age has 15.4% chance of dying before January 20, 2013, and a man of Obama's age has 2.0% chance of dying in the same period. By the way, the shorter the period we look at, the more significant a factor McCain's cancer is, because the probability of recurrence goes down the longer he's already survived.
McCain would be the oldest president to begin a first term in office. By the end of a second term, Jan. 20, 2017, he would have a 24.44 percent chance of dying, compared with 5.76 percent for Obama, the firm estimates.As far as I can tell, those numbers seriously understate the difference in the candidates' respective longevity prospects.
Let's start from the average mortality, given only the candidates' age and sex. McCain is 72 years and 32 days old and he will be 80 years and 144 days old on January 20, 2017. Using Social Security's life tables, his probability of dying before the end of his second term is 32.2%. Barack Obama is 47 years and 57 days old; his probability of dying by the same day, which in his case is age 55 years and 169 days, is 4.3%.
(Non-geeks may skip this paragraph: I used the 1940 cohort table for McCain and 1960 cohort table for Obama. Those are the closest to their birth years. Those choices favor McCain by the amount of mortality improvement from his 1936 cohort to the 1940 cohort. The difference is hardly negligible: using the 1930 cohort, we'd get 34.7% for the same ages, and linear interpolation yields approximately 33.2%, so the result I used is biased in McCain's favor by about 1 percentage point. Similarly, using 1960 cohort mortality for Obama introduces a slight - although almost negligible in this case - bias against Obama. One further geek note: I derived all survival probabilities by linear interpolation between nearest integer-year ages. That is more than accurate enough for the purpose of this analysis.)
Of course, there is more information available about the candidates, and Bragg lists some factors used:
He classified the Democrat as a smoker with minor upper respiratory problems, probably linked to his smoking. Obama announced in February that he was trying to quit smoking again, with the aid of nicotine gum.
"We don't consider you a nonsmoker until you stay quit for 12 months," said Brooks.
In the spring, the Obama campaign released a letter from the candidate's doctor declaring him to be in excellent health. He had very good cholesterol levels, his EKG was normal, his pulse was 60 beats per minute, and his blood pressure was an outstanding 90 over 60. Obama also exercises regularly.
But Obama has a family history of cancer. His mother died of ovarian cancer and his maternal grandfather died of prostate cancer. Obama's PSA screening test for prostate cancer showed no sign of abnormalities.
For the Republican, Brooks took into account a history of skin cancer, degenerative arthritis from his Vietnam war injuries, moderately high cholesterol, mild vertigo and that McCain is a former smoker who quit in 1980.
McCain allowed reporters to review eight years of medical records, more than 1,000 pages. They show that he is cancer-free, has a strong heart and is generally in good health. As a three-time melanoma survivor, his biggest health worry is a recurrence of that cancer. But he is closely watched by his dermatologist, and any future melanoma should be caught in time to be treated successfully. McCain maintains a healthy weight and blood pressure, and takes medication for his cholesterol.
That is hardly an unbiased account, and the statement that "McCain allowed reporters to review eight years of medical records" is, at best, barely true. In any case, the factors mentioned in the article should be worse news for McCain than for Obama.
Let's start with smoking. It is true that Obama wouldn't qualify for non-smoker rates if he applied for a life insurance policy today, but life insurance underwriting imposes rather crude discrete categories by necessity. (Verification is costly and the potential for cheating is high; for example, someone who smokes two packs a day could claim to smoke one pack a week.) This individualized analysis can do much better than that. Obama's quitting has not been entirely successful, but he is clearly closer to a former smoker than to a current one. McCain stopped smoking years ago, but he used to smoke two packs a day for 25 years. So they have a similar smoking history and quit at a similar age. By itself, this factor would make each of them more likely to die than an average man of their age. The effect is probably greater for Obama mainly because fewer men of his age are smokers, so average mortality for his cohort is based on a higher percentage of non-smokers. I would be curious to see what factors Bragg applied to account for smoking history.
(Another note for wonks: Insurers generally charge smokers double or even higher rates than nonsmokers, and that is soundly based on experience, but those factors apply to a baseline of the insured population, i.e., to the people who have passed other underwriting hurdles. For example, by the Society of Actuaries' 90-95 Basic Select tables, a male smoker of Obama's age would have about 3.5% chance of dying in the next 8 years, which is better than the average from the Social Security tables. Similarly, a smoker of McCain's age would have 23% chance of dying in the next 8 years, again better than in the SSA tables. Another thing to keep in mind is that, in insurance underwriting, smoking also serves as a proxy to other risky behavior, which means that not all of the excess mortality of smokers is caused by smoking.)
The candidates' fitness balances their smoking history. Both candidates seem to have healthy hearts, and Obama's pulse and blood pressure cited by Bragg are impressive. Obama is thin and McCain's weight is normal. They both seem significantly more fit than average men of their respective ages. Fitness-related mortality patterns are far less well known than smoking-related ones, but my guess would be that both candidates make up in fitness about as much as they lose from smoking history. Additionally, both are married and have (as far as we know) healthy spouses, which also improves their longevity prospects. Not to mention that both have access to best available health care.
So far, very similar adjustments to age/sex baseline apply to both candidates, but the rest is all bad news for McCain. Melanoma is a serious type of cancer, prone to metastasizing that is hard to detect and treat. It is true that McCain has been free of symptoms for 8 years and that it improves his prognosis, but the fact that he's had 4 episodes of melanoma, and that the last one was over 2 mm deep, raise additional concerns. For lesions like his last one, 5-year survival rate is 63-79% and 10-year 51-64%. He has survived for 8 years, so the greatest risk is behind him, but he is not out of the woods:
“With melanoma, a patient is never completely clear,” said Dr. Shapiro, the N.Y.U. expert.Precise estimates aren't available, but it is hard to see how McCain's chance of dying from this one cause alone would be less than 10% over the next 8 years.
If melanomas do recur, standard treatment options are limited for many to surgery and a difficult form of chemotherapy. The chances of long-term survival diminish.
Another issue for McCain is the long-term effects of maltreatment by the Vietcong. Five and a half years of injuries, torture and malnutrition certainly have health consequences. Quantifying the effect is difficult, but that's not a good reason to ignore it altogether.
In summary, there is little reason to think that Obama's probability of dying in the next 8 years exceeds that of an average man of his age - 4.3 percent. In fact, it is probably less than 3.5 percent, the number based on life insurance policy experience. On the other hand, I don't see how McCain's probability of dying in the same period would be much less than one-third. In other words, McCain is at least 9 times as likely to die in office as Obama. Bragg tells us it is not quite 4.5 times. Unless he publishes more details about the calculation and the assumptions, I can't see how his results could be justified.
UPDATE: It is probably wrong to focus on survival to the end of second term. Incumbency is an advantage in an election, but we don't elect a President for 8 years, and we would (hopefully) have updated health information before the next election. Going back to the baseline (Social Security tables), a man of McCain's age has 15.4% chance of dying before January 20, 2013, and a man of Obama's age has 2.0% chance of dying in the same period. By the way, the shorter the period we look at, the more significant a factor McCain's cancer is, because the probability of recurrence goes down the longer he's already survived.
Sep 8, 2008
Sanctity of shotgun marriage
Here's another reason to oppose gun control: it would destroy the sanctity of that foundation of our civilization - shotgun marriage.
We know Sarah Palin supports abstinence until marriage and that her pregnant daughter will marry the boy who had something to do with that. The boy was displayed last week as an example to all teenagers with raging hormones. Boys, this could happen to you if you knock up a girl: a creepy old presidential candidate will shake your hand and you'll get to stand on the central stage at the Republican National Convention, cheered by a wild crowd of mostly old people. So better watch out.
It's good that they are giving an example to the kids nationwide, but I think it is irresponsible to make two teens marry just because they made a baby. Marriage is supposed to be a lifelong commitment, and 17- and 18-year olds are not mature and experienced enough to decide on such commitment. According to CDC, brides younger than 18 have 1 in 2 chance of being divorced in 10 years and 2 in 3 chance of being divorced in 20. (By contrast, for brides over 25, the chances are 1 in 4 and 2 in 5, respectively.) In fact, I don't think it should be legal for anyone to marry before age 18, but that may be moot in this case, as Bristol Palin turns 18 on October 18. (Good thing teenagers get traffic tickets, otherwise we'd be left to speculate.)
Mrs. Pitt Bull and Mr. First Dude had a similar abstinence story of their own. Their first son was born 33 weeks and 3 days after their wedding, which would pin their elopement at some 2-3 weeks after her first missed period. Seems it was pregnancy test one day, shotgun wedding the next. Sure, they were 24 and had presumably been dating for a while, but it is still a bad way to make a life-changing decision. Wise couples marry when they want, not when they have to.
I will have none of the stupid knee-jerk reaction that those pregnancies and marriages are private matters and not important for the election. If Palin supported reproductive freedom of each individual and sex education grounded in science, I would not be the least interested in her own family planning and would be opposed to discussing any of this. But I am not willing to let her have the same privacy that she would deny to others. Her policy stance makes these private matters fair game.
Private or not, these personal stories provide important information about Gov. Palin's decision making and principles. Her express wedding is relevant because it shows that she let random events control her decisions instead of planning ahead and taking control of events. The speed with which she got married is also significant because it preserved some plausibility for the story that the baby was born just a little prematurely, and that suggests that she may have planned to lie to family and friends.
It is particularly relevant that she publicly opposed sex before marriage despite her own experience. (And what about the fact that, without premarital sex, Track Palin would never have been born? Isn't that one of the standard emotional appeals of the so-called "pro life" crowd?) Yet, she obviously did not persuade her daughter to postpone sex until marriage, so they are now rushing the marriage to bring it closer to sex.
So far, the facts do not bode well for the candidate's judgment, integrity and leadership. And I have not yet touched on the ethical issues with Sarah Palin's fifth child. That indictment of American head-in-the-sand values is coming soon.
UPDATE: Apparently, now she says she supports sex ed and is not for "abstinence only". Flip flop.
We know Sarah Palin supports abstinence until marriage and that her pregnant daughter will marry the boy who had something to do with that. The boy was displayed last week as an example to all teenagers with raging hormones. Boys, this could happen to you if you knock up a girl: a creepy old presidential candidate will shake your hand and you'll get to stand on the central stage at the Republican National Convention, cheered by a wild crowd of mostly old people. So better watch out.
It's good that they are giving an example to the kids nationwide, but I think it is irresponsible to make two teens marry just because they made a baby. Marriage is supposed to be a lifelong commitment, and 17- and 18-year olds are not mature and experienced enough to decide on such commitment. According to CDC, brides younger than 18 have 1 in 2 chance of being divorced in 10 years and 2 in 3 chance of being divorced in 20. (By contrast, for brides over 25, the chances are 1 in 4 and 2 in 5, respectively.) In fact, I don't think it should be legal for anyone to marry before age 18, but that may be moot in this case, as Bristol Palin turns 18 on October 18. (Good thing teenagers get traffic tickets, otherwise we'd be left to speculate.)
Mrs. Pitt Bull and Mr. First Dude had a similar abstinence story of their own. Their first son was born 33 weeks and 3 days after their wedding, which would pin their elopement at some 2-3 weeks after her first missed period. Seems it was pregnancy test one day, shotgun wedding the next. Sure, they were 24 and had presumably been dating for a while, but it is still a bad way to make a life-changing decision. Wise couples marry when they want, not when they have to.
I will have none of the stupid knee-jerk reaction that those pregnancies and marriages are private matters and not important for the election. If Palin supported reproductive freedom of each individual and sex education grounded in science, I would not be the least interested in her own family planning and would be opposed to discussing any of this. But I am not willing to let her have the same privacy that she would deny to others. Her policy stance makes these private matters fair game.
Private or not, these personal stories provide important information about Gov. Palin's decision making and principles. Her express wedding is relevant because it shows that she let random events control her decisions instead of planning ahead and taking control of events. The speed with which she got married is also significant because it preserved some plausibility for the story that the baby was born just a little prematurely, and that suggests that she may have planned to lie to family and friends.
It is particularly relevant that she publicly opposed sex before marriage despite her own experience. (And what about the fact that, without premarital sex, Track Palin would never have been born? Isn't that one of the standard emotional appeals of the so-called "pro life" crowd?) Yet, she obviously did not persuade her daughter to postpone sex until marriage, so they are now rushing the marriage to bring it closer to sex.
So far, the facts do not bode well for the candidate's judgment, integrity and leadership. And I have not yet touched on the ethical issues with Sarah Palin's fifth child. That indictment of American head-in-the-sand values is coming soon.
UPDATE: Apparently, now she says she supports sex ed and is not for "abstinence only". Flip flop.
Aug 6, 2008
Presidential terms and actuarial errors
Atlanta Journal-Constitution reports that the actuarial firm John M. Bragg & Associates has estimated the healthy life expectancy - average remaining life free of Alzheimer's or other impairments requiring an assisted living facility - for John McCain and Barack Obama. Bragg gives McCain a health expectancy of 8.4 years, and Obama 21.9 years, and offers the following conclusion:
“Either candidate can be expected to serve two full terms, without age or health being an issue,” said John M. Bragg, the firm chairman.
John Aravosis points out that Bragg's numbers don't add up:
The actuarial (sic) says McCain has 8.4 "healthy" years left. He mistakenly drew the conclusion that McCain would therefore be healthy through two terms in office, thinking that eight years from now is the end of McCain's term. That's incorrect. The end of the term is in 8 years 5.5 months from now. Statistically, that means McCain won't make it through two terms as a "healthy" president. By healthy, he means “the person does not require the care provided by an assisted living facility and is free of Alzheimer’s disease.”
By my back-of-the-envelope calculations, that means McCain wouldn't even be able to complete two full terms in office. His time runs out on December 30th or so of 2016, a good three weeks before the new president would be sworn in. So that means, statistically speaking, before the end of two terms, we should expect President McCain to have to be moved to a retirement home because he'll no longer be able to care for himself, and we should expect that he'll already be suffering from Alzheimer's.
Aravosis is correct in noting that 8.4 years from now does not give the new President (whoever it is) two full terms. His explanation of what that means is a little sloppy, but the end result is most likely correct. The issue is what it means that "we should expect" McCain (not) to be healthy and alive by the end of the two terms. I assume that Aravosis means "it is more likely than not", but that doesn't follow so simply from the published statistic.
Mathematical expectation is the theoretical mean, not median. What it means is the following: if we had a thousand men of the same age and other relevant characteristics as John McCain, we follow them all until they die and note how long each lives, and then we sum up all of their times from now until death, and divide the result by 1000 (the number of them), we will get something very close to 8 years, 146 days.
It does not mean that 500 of them will live longer than 8.4 years and the other 500 shorter. That would follow only if the remaining lifetime were distributed symmetrically, for example, if it followed the bell-shaped normal distribution. But that is not the case: all remaining lifetimes must be greater than zero, but there is no reason some of them couldn't be 30 years or more. The expectation (8.4 years) is obviously not in the middle of the range, so the distribution is skewed (asymmetric).
Now it turns out that, in most distributions of this kind (with a "tail" on the right), the median is less than the mean. If the median healthy survival is less than 8.4 years, it would mean that fewer than 500 of the initial 1000 "McCain clones" would have more than 8.4 years of healthy life - and, obviously, even fewer would have 8.46 or so years needed to complete two terms in office. So Aravosis made a correct statement, after all.
If Aravosis is correct, Bragg must be incorrect. It is not possible to say, based on Bragg's own numbers, that McCain "can be expected to serve two full terms, without age or health being an issue". Because the median is almost certainly lower than the mean, it would not be true even if the expected healthy life were somewhat longer, say 8.5 years, extending beyond two terms. It would still imply that McCain is more likely than not to die or become seriously impaired before the end of the second term.
But this error in arithmetic is not the most bothersome part of Bragg's statement. After all, if all the critique amounted to were nitpicking about chances being 49% rather than 51%, it would be rather academic. I see a far more serious problem in Bragg's choice of risk measure.
Suppose for a moment that Bragg's arithmetic was right, and that McCain could be expected, albeit barely so, to be alive and healthy on January 20, 2017. Suppose his chances are 55%. That's a generous "improvement" of Bragg's estimate, but it still means a 45% chance he would be dead or incapacitated. Would most people be comfortable with a president facing those odds? Would most people, upon hearing that number, characterize a potential McCain presidency as "without age or health being an issue"? I doubt that. From the risk management point of view, Bragg has cited an almost useless statistic.
John M. Bragg is not just any actuary. He was President of the Society of Actuaries. That, however, was a long time ago, when the US President was named Gerald Ford.
Aug 3, 2008
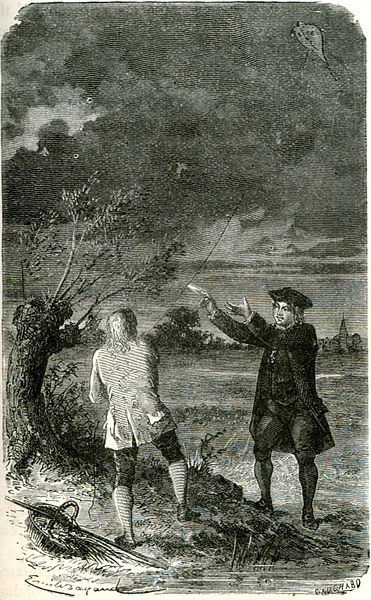
Swimming with Ben Franklin
I headed to the pool yesterday, in mostly sunny weather, but just when I got there, distant thunder could be heard. The lifeguard followed the standard procedure and ordered all the people out of the pool before I could get my toes wet. I didn't have time to stay and wait for half an hour or more, so I turned around and walked home, not getting the 20-30 minute swim I had hoped for.
I wonder whether this risk-averse policy of preventing lightning strikes in the pool makes sense. To answer that question, we need some quantitative measures of risk, not just an explanation why it is risky to be in water in or near a thunderstorm. Of course, being in water increases risk, but by how much? There are indications that expert advice tends to be more risk-averse than most people would be willing to follow. For example, the National Lightning Safety Institute says that cars are safe (because of their metal shell), but only if you
I wonder whether this risk-averse policy of preventing lightning strikes in the pool makes sense. To answer that question, we need some quantitative measures of risk, not just an explanation why it is risky to be in water in or near a thunderstorm. Of course, being in water increases risk, but by how much? There are indications that expert advice tends to be more risk-averse than most people would be willing to follow. For example, the National Lightning Safety Institute says that cars are safe (because of their metal shell), but only if you
close the windows, lean away from the door, put your hands in your lap, don't touch the steering wheel, ignition, gear shifter, or radio.
That means you shouldn't drive in a storm. But how realistic is that? Imagine the traffic coming to a standstill every time a thunderstorm is near. Similarly, if you are at home, you shouldn't take a shower or wash your hands during a storm, because plumbing is part of the house's conductive shield, and touching it - directly or through water - puts you at risk. But seriously, how many people have died or been injured by lightning while washing hands at home?
Numbers matter because foregoing unsafe actions is usually costly. If traffic stopped in storms, there would be significant economic losses, and moreover (if you think money is not worth the risk), parents would be late picking up children from day care and patients would not get to hospitals on time. Not washing hands may increase your risk of getting ill, which may - depending on the numbers - outweigh the risk of getting shocked by lightning. Similarly, in my case, I am not sure if foregoing swimming to reduce the risk of lightning was a net benefit to me.
Exercise is healthy; it improves life expectancy as well as the quality of life. I estimate that half an hour of swimming would have increased my life expectancy by a few minutes. My reasoning for that estimate uses the analogy with smoking. It is often reported that smoking one cigarette shortens your life expectancy by about 10 minutes. (That's consistent with the assumptions that an average smoker smokes 20 cigarettes per day for 40 years and lives about 6 years less than a non-smoker with the same characteristics.) While I have no data supporting this, it seems intuitively plausible that a good aerobic exercise session would improve one's health by about the same order of magnitude as one cigarette would damage it.
Now, my life expectancy is about 20,000,000 minutes, so I should be willing to risk a one-in-a-few-million chance of being struck by lightning to obtain the life-prolonging benefits of exercise. And so far, this calculation doesn't take into account the pleasure derived from swimming. We pursue pleasures involving risk of death every day. Driving 7-8 miles to the mall or theater implies about 1 in 10 million chance of dying in a car accident (and a much higher chance of being injured). 5,000 food poisoning deaths per year in the US amount to about 5 per meal (1 in 60 million), with serious illness requiring hospitalization being 60 times as likely. And I am not even talking about activities that are normally perceived as risky.
What about lightning? It is hard to find relevant statistics. About 1 in 6 million Americans is killed by lightning every year, and about 8% of those deaths are water-related (but 40% are "unknown"). However, a lot of the water-related lightning accidents occur on small open boats, so it is unclear how many are swimming-related. And, of course, most people take safety measures, so it is hard to know the exposure underlying those accident statistics. They don't help with the specific question I had:
What is the probability of being struck by lightning during a single 30-minute swim in an outdoor swimming pool when a thunderstorm is nearby?
If this risk is of the order of one in several million, it is better to swim anyway. If it is, say, one in a hundred thousand or less, the standard safety procedures make a lot of sense.
I could make it more precise by listing several other factors. Lightning was not visible and by the rolling sound of thunder, I am pretty sure the storm was more than 5 miles away. The pool is lower than most surrounding areas, including the pool house. A train station is just about 200 yards away, with various structures likely to attract lightning. There are plenty of houses, trees, and electric lines in the vicinity - it is a densely populated area. It seems to me that all those factors reduce the risk of a direct strike to the pool (and thus of a deadly strike to the swimmer), although some of them might increase the risk of a strike close enough that some charge might find its path through the pool (but this would seem to be more relevant to the risk of lighter injuries).
Does anyone have some relevant quantitative data?
Jul 24, 2008
Why centrist voters elect extreme politicians
Andrew Gelman notes that, on a one-dimensional scale of ideological positions,
elected representatives are generally more extreme than voters.
Moreover, geographic polarization of legislators is much more pronounced than that of the voters:

I am not sure what wisdom we are supposed to gain from those facts, but I see some serious problems with the analysis, even if we grant that measuring ideology on a one-dimensional scale is itself unproblematic.
How meaningful is a comparison between voters' survey responses and legislators' votes? I am not asserting a "words vs. deeds" distinction here; voting is a form of speech, especially votes are publicly known, as legislators' votes are. But legislators are actually held responsible for their votes and expected to be consistent. The public, regardless of ideology, tends to like people with strong principles and dislike "flip-floppers". As much as we sometimes think of them as stupid or ignorant, politicians are, on average, unquestionably better informed and have thought more thoroughly about issues than the general public. We should expect their views to be more consistent than voters' views.
Now, there are rarely consistent "moderate" or "centrist" positions on most issues. Political moderates usually hold "left" positions on some issues and "right" positions on others. In George Lakoff's words, they are biconceptuals:
The pressure to dissemble comes from certain commonplace myths about swing voters and the "center." So for starters, let's put to rest the notion of the political or ideological "center"---it doesn't exist. Instead, what we have are biconceptuals---of many kinds.
A more cynical view would be that the "centrists" are inconsistent, confused, or hypocritical. While it would probably be considered unfair to characterize an ordinary private citizen that way, most politicians would very quickly (and perhaps rightly) earn those labels if their voting patterns resembled the survey responses of "centrist" voters.
The next question is why a centrist electorate would elect a polarized legislature. An obvious explanation is the two-party system and electoral districts drawn to put most Congressional seats safely under control of one or the other party. I would agree that those features of our political system increase the polarization of Congress, but the graphs strongly suggest that such an explanation is woefully incomplete.
First, the Senate seems to be no less polarized than the House, and geographically even more so, which belies the safe districts part of the argument. Second, there seems to be very little difference between voters in "battleground states" and "Democratic states", but a vastly different distribution of elected officials, particularly senators. As the states are grouped by the results of Presidential elections, this observation is by no means tautological.
The graphs tell us that very similar electorates consistently elect ideologically very different politicians. A likely explanation is that the survey responses do not measure overall ideological positions accurately. Perhaps voters put significantly different weights on different issues, which makes them prefer different politicians despite having similar (unweighted) average survey responses? That's a conjecture, not a conclusion; the point is that the analysis presented so far is not satisfying and it generates more questions than it answers.
Nov 16, 2007
At Least Saddam Can't Use Air Conditioning Any More
Solar Power Rocks has an amazing graph comparing R&D investments in energy to the cost of war in Iraq.
Since you won't be able to see the whole thing on the screen at once, you may be left with the question "Wholy shit! But how do those things compare if you don't have to scroll?" Answer: imagine a dog house next to Sears Tower. And make sure it's a small doghouse.
Since you won't be able to see the whole thing on the screen at once, you may be left with the question "Wholy shit! But how do those things compare if you don't have to scroll?" Answer: imagine a dog house next to Sears Tower. And make sure it's a small doghouse.
Oct 13, 2007
Framing, Damn Framing, and Statistics
I am not the least bit opposed to framing in principle. However, framing gurus should take care not to feed the (fairly common) opinion that framing equals paltering. Matt Nisbet fails that task with this graph:

Nisbet is showing this to support his thesis that there are "two Americas" and that only the one that agrees with Al Gore politically has become more concerned about climate change in recent years. But that is not a valid reading of the graph unless the relative numbers of the Democrats and Republicans have been stable over the period, and data from the same source suggest that they haven't. There are fewer Republicans now than a few years ago. If we assume that most of the party-switchers are moderates and that most moderates are concerned about climate change - and both assumptions seem reasonable - then the remaining loyal Republicans are, on average, more partisan and more dogmatic than before, and the divergence of the two lines in the graph just illustrates that corollary.
There are more conclusions that can be drawn from that graph, but none of them is about Al Gore's ineffectiveness.

Nisbet is showing this to support his thesis that there are "two Americas" and that only the one that agrees with Al Gore politically has become more concerned about climate change in recent years. But that is not a valid reading of the graph unless the relative numbers of the Democrats and Republicans have been stable over the period, and data from the same source suggest that they haven't. There are fewer Republicans now than a few years ago. If we assume that most of the party-switchers are moderates and that most moderates are concerned about climate change - and both assumptions seem reasonable - then the remaining loyal Republicans are, on average, more partisan and more dogmatic than before, and the divergence of the two lines in the graph just illustrates that corollary.
There are more conclusions that can be drawn from that graph, but none of them is about Al Gore's ineffectiveness.
Sep 13, 2007
Do Religious People Give More, Or Just Lie More?
PZ Myers responds to an article by Jonathan Haidt which starts out great, but segues into a rant against "New Atheists". It is interesting to read both articles as well as comments. One of the many points of contention was this:
PZ offers plausible, but speculative, counterpoints before pointing out that such results, even if true, are irrelevant to the issue of whether religion is true. He also correctly points at the inconsistency of justifying Christianity (which is the de facto dominant American religion) on hedonistic and utilitarian grounds.
Still, I was curious about those surveys, particularly because Haidt accused none other than Daniel Dennett, the most cautious of the "New Atheists", of willfully ignoring evidence and of thinking morally under the guise of thinking scientifically:
Thankfully, a commenter critical of PZ provided a link to Brooks' own summary of that study. Another commenter linked to a mild criticism of Brooks on The Volokh Conspiracy. But there is a lot more to criticize!
Brooks' definition of "secular", based entirely on infrequent religious service attendance, includes 26% of the total sample. The most optimistic numbers I've seen for nonreligious in any poll are around 14%, which means that about half (and possibly more) of the so-called "secular" were in fact religious people who rarely or never attend services. Those probably differ significantly from the nonreligious, so which subgroup is driving the results?
ReligiousTolerance.org (RT) has an analysis of false self-reporting of attendance cites sources that estimate that, although about 40% Americans report that they attend services weekly, only 20% actually do. Brooks counts 33% of his sample among the "religious" based on weekly attendance; it would thus appear that a third of those are only included because they lied.
Even more interestingly, the RT page cites Barna Group data that, while 17% report giving 10% or more of their income to their church, only 3% actually do. So we know from previous studies that self-reported giving is exaggerated. The usual explanation is that people say they do what they think they should do, not what they actually do. If the religious have a stronger sense that they should give more than they do, they will exaggerate their giving more.
I think that's enough to invalidate any conclusions from Brooks' study, but, as a general rule, whenever you see a policy paper, don't forget to check the sources and the context. This was published by the Hoover Institution, a conservative think tank. It is true that Hoover is more credible than Heritage and AEI - not everyone at Hoover is a hack - but keep in mind that Dinesh D'Souza is a fellow there. As a further clue to author's bias, note that Brooks approvingly quotes Robert Bork and Irving Kristol. I must say I would have more confidence in honesty and objectivity of a Vatican study on the same topic.
In light of such glaring problems with Brooks' study, I wonder how Haidt can honestly write
He was addressing Dennett's statement that "[c]ertainly no reliable survey has yet been done that shows" that "as a group atheists and agnostics are [less] respectful of the law, [less] sensitive to the needs of others, or [less] ethical than religious people." Well, I have proven above that Brooks' study is not reliable, so Haidt is the one not thinking scientifically when he uses it as evidence against Dennett.
Haidt says that "surveys have long shown that religious believers in the United States are happier, healthier, longer-lived, and more generous to charity and to each other than are secular people,"
PZ offers plausible, but speculative, counterpoints before pointing out that such results, even if true, are irrelevant to the issue of whether religion is true. He also correctly points at the inconsistency of justifying Christianity (which is the de facto dominant American religion) on hedonistic and utilitarian grounds.
Still, I was curious about those surveys, particularly because Haidt accused none other than Daniel Dennett, the most cautious of the "New Atheists", of willfully ignoring evidence and of thinking morally under the guise of thinking scientifically:
I have italicized the two sections that show ordinary moral thinking rather than scientific thinking. The first is Dennett's claim not just that there is no evidence, but that there is certainly no evidence, when in fact surveys have shown for decades that religious practice is a strong predictor of charitable giving. Arthur Brooks recently analyzed these data (in Who Really Cares) and concluded that the enormous generosity of religious believers is not just recycled to religious charities.
Thankfully, a commenter critical of PZ provided a link to Brooks' own summary of that study. Another commenter linked to a mild criticism of Brooks on The Volokh Conspiracy. But there is a lot more to criticize!
Brooks' definition of "secular", based entirely on infrequent religious service attendance, includes 26% of the total sample. The most optimistic numbers I've seen for nonreligious in any poll are around 14%, which means that about half (and possibly more) of the so-called "secular" were in fact religious people who rarely or never attend services. Those probably differ significantly from the nonreligious, so which subgroup is driving the results?
ReligiousTolerance.org (RT) has an analysis of false self-reporting of attendance cites sources that estimate that, although about 40% Americans report that they attend services weekly, only 20% actually do. Brooks counts 33% of his sample among the "religious" based on weekly attendance; it would thus appear that a third of those are only included because they lied.
Even more interestingly, the RT page cites Barna Group data that, while 17% report giving 10% or more of their income to their church, only 3% actually do. So we know from previous studies that self-reported giving is exaggerated. The usual explanation is that people say they do what they think they should do, not what they actually do. If the religious have a stronger sense that they should give more than they do, they will exaggerate their giving more.
I think that's enough to invalidate any conclusions from Brooks' study, but, as a general rule, whenever you see a policy paper, don't forget to check the sources and the context. This was published by the Hoover Institution, a conservative think tank. It is true that Hoover is more credible than Heritage and AEI - not everyone at Hoover is a hack - but keep in mind that Dinesh D'Souza is a fellow there. As a further clue to author's bias, note that Brooks approvingly quotes Robert Bork and Irving Kristol. I must say I would have more confidence in honesty and objectivity of a Vatican study on the same topic.
In light of such glaring problems with Brooks' study, I wonder how Haidt can honestly write
These data are complex and perhaps they can be spun the other way, but at the moment it appears that Dennett is wrong in his reading of the literature.
He was addressing Dennett's statement that "[c]ertainly no reliable survey has yet been done that shows" that "as a group atheists and agnostics are [less] respectful of the law, [less] sensitive to the needs of others, or [less] ethical than religious people." Well, I have proven above that Brooks' study is not reliable, so Haidt is the one not thinking scientifically when he uses it as evidence against Dennett.
Jul 13, 2007
Laffing My Ass Off
Today's Wall Street Journal editorial has the most idiotic Laffer curve I've seen yet. You need subscription to read it, but the absurd diagram is available via Economist's View:

So that's how AEI and WSJ fit curves to data: Take a bunch of points, draw the curve you want through 2-3 points that are the most convenient to tell your preconceived story, and ignore the rest. Oh, yes, and assume your readers are complete morons, so you don't even have to hide what you've done.
Jun 16, 2007
A Third of Americans Disagree with Themselves
I am finally getting around to commenting on this poll, but I will not dwell on high numbers of Americans who reject evolution (alas, I already know that) or the particularly high numbers of Republicans who do so (gee, whoda thunk). What caught my eye was this table:
(Scroll down if you see a big white space, I haven't figured out how to eliminate it.)
(Scroll down if you see a big white space, I haven't figured out how to eliminate it.)
View of Evolution and View of Creationism | |||||
| |||||
| Probably | Probably | Definitely | ||
% | % | % | % | ||
View of Evolution | Definitely true | 3 | 1 | 2 | 11 |
Probably true | 5 | 14 | 12 | 3 | |
Probably false | 6 | 8 | 1 | 1 | |
Definitely false | 24 | 3 | * | 1 | |
* Less than 0.5% | |||||
I commend Gallup for publishing this 2-dimensional table. In press releases, pollsters rarely show data along more than one dimension at a time, which makes it difficult to discern any correlations. And there are some amazing finds in this table.
If you sum up the numbers in the four cells in the top left quadrant, you find that 23% of Americans say that both evolution and creationism are definitely or probably true. (Actually, Gallup states the fraction as 24%, probably correcting for rounding errors.) It is logically possible to disbelieve both (e. g., one can believe that non-divine space aliens brought us to Earth), and 3% of respondents took that position, but how do you believe both theories? Was the question asked in a way that presented them as compatible? Let's see:
Next, we'd like to ask about your views on two different explanations for the origin and development of life on earth. Do you think -- [ITEMS ROTATED] -- is -- [ROTATED: definitely true, probably true, probably false, (or) definitely false]?
A. Evolution, that is, the idea that human beings developed over millions of years from less advanced forms of life
B. Creationism, that is, the idea that God created human beings pretty much in their present form at one time within the last 10,000 years
While the question does leave a lot to be desired (introduction talks about the origins of life on earth, but both options mention the development of human beings), it is impossible to interpret the two options as logically compatible. You can't say both are true without violating the laws of logic. So, 24% of respondents made no sense!?
It is worse than that, actually. If you consider one of the theories to be "definitely true", you must, logically, consider the other "definitely false". So everything above and to the left of the diagonal is logically inconsistent. That is 6 cells, not just 4, and the percentages add up to 31%. Almost a third of respondents couldn't answer the two questions without contradicting themselves!
Much to my chagrin, the evolutionists, as a whole, did no better in the logic department than the creationists: in both camps, about a third of "definitely true" supporters and more than half of the "probably true" supporters violated logic. Worse yet, as there are fewer "definitely true" evolutionists, the total percentage of logic violators is actually somewhat higher among evolutionists (49% to 45%).
What could be the reasons for such massive inconsistency?
Some people may genuinely contradict themselves, but I doubt that they account for a significant part of the 31% logically challenged.
A lot more people could have misunderstood the questions. Too much information may have been packed into those two questions, and a rather narrow version of creationism is described (young-earth creationism). A lot of people actually believe in both evolution and creation to some extent, just not in the variants described. (More about those people in a bit.) If they didn't listen to the questions past the first words, they might have thought they agreed with both.
The results could be biased if people tend to give answers they think will please the investigator or sound agreeable. Since there was no neutral option (distinct from "no opinion") given, those who really think that "the jury is still out" had to choose between a weak positive and a weak negative opinion. And the actual responses break overwhelmingly in favor of weak positives: 35-16 for evolution, 27-16 for creation. As for the options available to true fence-sitters, double "probably true" beats double "probably false" 14 to 1. I think this bias accounts for something, but it is hard to believe that there could be so many people sitting on the fence without even leaning to one side.
Finally, the explanation may be in the people whose views differ from either option, but have something in common with both:
A separate Gallup Poll trend question -- also asked in May -- gave Americans three choices about human beings' origins. Responses to this question found that 43% of Americans choose the alternative closest to the creationist perspective, that "God created human beings pretty much in their present form at one time within the last 10,000 years or so." A substantial 38% say human beings evolved, but with God guiding the process. Another 14% favored an interpretation of evolution arguing that God had no part in the process, leaving a total of 52% who say humans evolved with or without God's direction.
52% is remarkably close to the 53% who, in the two-way poll, say evolution is definitely or probably true, and one would expect that theistic evolutionists would choose one of those answers. On the other hand, the two theistic views (creation and theistic evolution) account for 81% of respondents, which far exceeds the 66% that said creation was definitely or probably true. But that, too, is to be expected, because theistic evolution and young-earth creationism are mutually exclusive. The surprising result is not that the support for creationism doesn't gain 38% from the 3-way to the 2-way poll, but that it gains anything substantial, let alone 23%.
So, do the theistic evolutionists explain the supporters of both views? Not entirely - for example, fewer people are in the "definitely evolution, definitely not creation" corner than support non-theistic evolution in the 3-way poll - but a reasonable case can be made that most of the strange, illogical answers are due to theistic evolutionists. If about 60% of them didn't pay attention to the full description of creation, and heard only the part they agreed with ("God created human beings"), practically all of the double-support puzzle would be explained.
If it is implausible (and even offensive to the theistic evolutionist group) that 60% would have attention span shorter than 5 seconds, there is an almost equivalent, but more plausible and, possibly, less condescending explanation. Most people have a really hard time thinking in terms of probabilities, and a statement like "A is probably true" means to them something very different from what it means to me or to Gallup pollsters. I would automatically read it as "The probability that A is true is between 50% and 95%". (The upper limit of the range is the only unclear piece - should it be 90%? Or 99%? Maybe 99.99%?) But such numerical probabilities would mean nothing to many people; to make sense of the original statement, they may need to reinterpret it as "I somewhat agree that A is true." Of course, it means something quite different, but if your language doesn't have words for certain concepts, you make do with the best translation you can find (or make up).
If I am on the right track, there was a miscommunication between the pollsters and a substantial number of respondents. Those respondents changed the meanings of the answers: "definitely true" became "I agree strongly", "probably true" became "I agree somewhat" and so on. Such people could hold any of the substantive views probed by the poll; in most cases, there won't be any effect on the results. But take a theistic evolutionist who has to evaluate creationism. He believes that God created humans, by guiding the evolution process or intervening in it, but doesn't believe it happened as recently as literary interpretations of Genesis suggest. If he understands the options given by the poll, he will say that creation is definitely false (or probably false, if he is not so sure that Genesis is not literally true). But if he reinterprets the options as I think is likely, he can easily choose the option that, to him, sounds like "I agree somewhat", even if he is absolutely sure that the earth is billions of years old and that humans have emerged hundreds of thousands of years ago. After all, how significant are some numbers compared to God's act of creation?
To summarize, if 60% of all people can't think probabilistically, and that percentage is about the same among theistic evolutionists, the misunderstanding between pollsters and respondents can account for most of the anomalous result in the 2-way poll.
It's still depressing. A third of Americans contradict themselves, and most of those are unaware that they do.
May 9, 2007
The Mismeasure of Bias
This is one of the most astute critiques of a methodologically flawed paper that purports to measure ideological bias in the media. Nyhan's main points are:
He quotes other sources, too, and this argument from Media Matters is particularly convincing:
And there are more general issues that would remain even if these details were somehow fixed. The very notion that some average (median or whatever) of population's views is "unbiased" is unfounded; and, even if the population's median view were deemed "unbiased" by definition, there would still be a big leap from the median member of Congress to the median voter, and another from the median voter to the median member of the population.
Too bad Andrew Gelman's endorsement of Brendan Nyhan's critique is only lukewarm, even though he realizes that "bias" is a misnomer for the quantity that G&M measured. More generally, it is sad that so often people with great analytical skills fail to appreciate the world beyond the limitations of a mathematical model.
(1) Technocratic centrist to liberal organizations like Brookings and the Center on Budget and Policy Priorities tend to have more credentialed experts with peer-reviewed publications than their conservative counterparts. This may result in a greater number of citations by the press, which seeks out expert perspectives on the news, but not more citations by members of Congress, who generally seek out views that reinforce their own.
(2) The Groseclose/Milyo methodology doesn't allow for differential rates of productivity in producing work of interest to the media or Congress between organizations. To the extent that a think tank is better at marketing itself to the press than Congress (or vice versa), it could skew the results.
He quotes other sources, too, and this argument from Media Matters is particularly convincing:
For instance, according to their data, the National Association for the Advancement of Colored People (NAACP) is the third most-quoted group on the list. But stories about race relations that include a quote from an NAACP representative are unlikely to be "balanced" with quotes from another group on their list. Their quotes will often be balanced by quotes from an individual, depending on the nature of the story; however, because there are no pro-racism groups of any legitimacy (or on Groseclose and Milyo's list), such stories will be coded as having a "liberal bias."
And there are more general issues that would remain even if these details were somehow fixed. The very notion that some average (median or whatever) of population's views is "unbiased" is unfounded; and, even if the population's median view were deemed "unbiased" by definition, there would still be a big leap from the median member of Congress to the median voter, and another from the median voter to the median member of the population.
Too bad Andrew Gelman's endorsement of Brendan Nyhan's critique is only lukewarm, even though he realizes that "bias" is a misnomer for the quantity that G&M measured. More generally, it is sad that so often people with great analytical skills fail to appreciate the world beyond the limitations of a mathematical model.
Subscribe to:
Posts (Atom)


